Graphical User Interface
Description
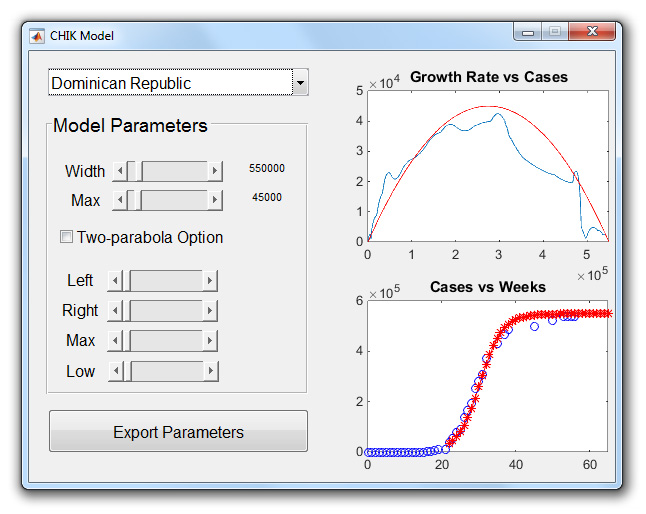
This Graphical User Interface (GUI) was developed in MATLAB. It allows the user to visualize the effect of changes in model parameters and to quickly select the most appropriate parameter values for each country. The menu at the top lists all of the countries in the PAHO data file, the sliders allow to select the one-parabola or two-parabola model parameters, and the graphs on the right show the growth rate G as a function of N (top) and the number of cases as a function of time (bottom). The "Two-parabola Option" checkbox toggles between the one-parabola and two-parabola versions of the model. The "Export Parameters" button saves all of the parameters, as well as the predictions for the number of cases in each country, into an Excel file called "CHIK_Model_Output.xlsx". As parameters are changed, the effect on the growth rate G(N) and on the number of cases as a function of time is immediately visualized in the two plots.
Download
The GUI is packaged as a MATLAB app available for download. The current input file has been updated to include reported data until May 08, 2015. The preset parameter values are those we used for our last submission.
- Click on the above link to download the packaged MATLAB app, called "CHIK_Model.mlappinstall."
- Once the file has downloaded, double-click on it. This will open MATLAB, which needs to be installed on your computer (version R2014 or later).
- Follow the instructions within MATLAB to install the app. After installation, an icon for "CHIK Model" will appear in the MATLAB APPS toolstrip. Click on the icon to run the app.
- Even though the output file template is packaged with the app, it is recommended to also download "CHIK_Model_Output.xlsx" and place this file in the same directory as the MATLAB app file. This will prevent the display of an error message when the "Export Parameters" button is clicked, and will save the data in the above Excel template file.